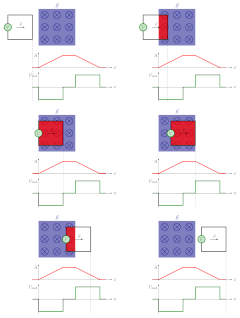
#!/bin/bash
set -eu
DIR="animate"
FILE="Induction"
NUM=0
rm ${DIR}/frame???.png
for XPOS in -0.5 -0.25 0 0.25 0.5 0.75 1 1.25 1.5 1.75 2 2.25 2.5 2.75 3 3.25 3.5 3.75 4 4.25 4.5 4.75 5 5.25 5.5  ; do
    sed -i "s/\\\def\\\posx{.\+}/\\\def\\\posx{$XPOS}/" $FILE.tex
    echo "Creating frame $NUM for $XPOS ..."
    pdflatex -shell-escape $FILE.tex 1> /dev/null
    echo "Convert to png ..."
    NUMSTR=$(printf "%03d" $NUM)
    convert -density 200 ${FILE}01.svg -shave 3 ${DIR}/frame${NUMSTR}.png
    NUM=$(($NUM+1))
done
cd $DIR
convert -delay 20 -loop 10000 frame*.png  ${FILE}.gif
cd -
\documentclass[crop,border=5,tikz,convert={outext=,
  command=\unexpanded{pdf2svg \infile\space\outfile\%02d.svg
    all}},multi=false]{standalone}
\usetikzlibrary{math,calc,through,shapes,patterns,decorations.pathmorphing}

\def\posx{-0.5}

\begin{document}
\begin{tikzpicture}[>=latex]
  \fill[white] (-3,3.5) rectangle (6.5,-4.8);
  \node[black!50!blue] at (1.5,3.3) {$\vec{B}$};
  \fill[black!50!blue!50] (0,0) rectangle (3,3);
  \begin{scope}[shift={(0.5,0.5)}]
    \foreach \x in {0,1,2}{
      \foreach \y in {0,1,2}{
        \draw[thick,black!50!blue] (\x,\y) circle (3mm);
        \draw[thick,black!50!blue]
        (\x-0.21213,\y-0.21213)--(\x+0.21213,\y+0.21213);
        \draw[thick,black!50!blue]
        (\x+0.21213,\y-0.21213)--(\x-0.21213,\y+0.21213);
      }
    }
  \end{scope}
  \begin{scope}[shift={(\posx,0)}]
    \fill[red,opacity=0.75] (-2,0.5) rectangle
    (0,2.5);
    \fill[white] (-3-\posx,0.5) rectangle (0-\posx,2.5);
    \fill[white] (3-\posx,0.5) rectangle (6-\posx,2.5);
    \draw[ultra thick] (-2,0.5) rectangle (0,2.5);
    \draw[ultra thick,black!50!green,fill=black!50!green!20] (-2,1.5) circle (3mm) node[black!50!green]{$V$};
    \draw[dashed] (0,1.5) --+ (0,-6);
    \draw[thick,->] (-1.3,1.5) --+ (0.7,0)
    node[midway,above]{$\vec{v}$};
  \end{scope}
  \begin{scope}[shift={(0,-1.8)}]
    \draw[ultra thick,red]
    (-0.5,0)--(0,0)--(2,1)--(3,1)--(5,0)--(5.5,0);
    \draw[->] (0,-0.1) -- (0,1.25) node[anchor=north east]{$A$};
    \draw[->] (-0.5,0) -- (6,0) node[anchor=west]{$x$};
  \end{scope}
  \begin{scope}[shift={(0,-3.4)}]
    \draw[ultra thick,black!50!green]
    (-0.5,0)--(0,0)|-(2,-1)|-(3,0)|-(5,1)|-(5.5,0);
    \draw[->] (0,-1.25) -- (0,1.25) node[anchor=north east]{$U_\mathrm{ind}$};
    \draw[->] (-0.5,0) -- (6,0) node[anchor=west]{$x$};
  \end{scope}
\end{tikzpicture}

\end{document}


